
To collect boring descriptions, webGIS generates a form that contains an index map locating the boring on the site, a table that contains previously recorded intervals, and inputs for adding new interval data.
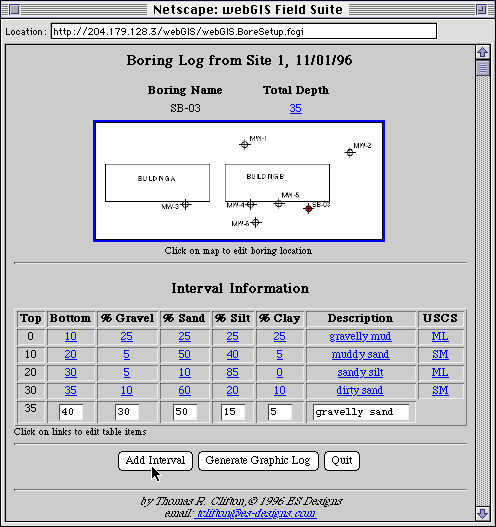
Screenshot of boring description data entry form.
On the boring description form, the geoscientist enters the base depth of the new interval and the percent gravel, sand, silt, and clay. This version of the boring log tool takes these data and calculates the appropriate Unified Soil Classification System (USCS) class for the interval. This information is transmitted back to the site database where it is entered into the site database. The form returns with inputs open for the next interval.
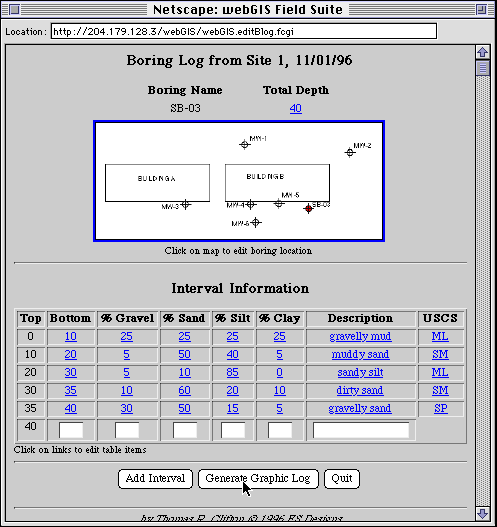
Screenshot of boring description form with previous data added to table.
Data in the boring log table can be edited by clicking on the links within the table. The boring location can be changed by on the index map and then relocating the boring. Finally, a graphic log of the boring can be produced by clicking on the "Generate Graphic Log" button
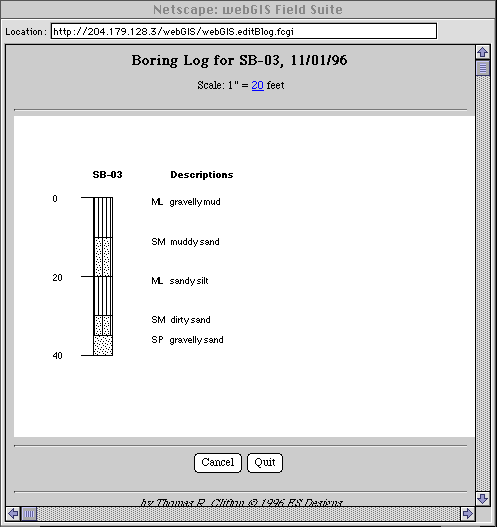
Screenshot of Graphic log of boring.
The scale of the graphic log can be edited by clicking on the scale text. You can run a demonstration of the boring data collection tools from the Web Application Demos page.